Normal Distribution
[26/100%]A woman wrote Dear Abby, saying she had been pregnant for 310 days before giving birth. Completed pregnancies are normally distributed with a mean of 266 days and a standard deviation of 16 days. What is the probability that a completed pregnancy lasts at least 310 days?
Daily stock returns are often modeled as random draws from a normal distribution. The daily returns on the SP 500 index of stock prices over the 50-year period, 1962-2012 had a mean of and a standard deviation of . If daily SP 500 returns are normally distributed with this mean and standard deviation, what is the probability of a daily return as low as , which happened on October 19, 1987?
In his 1868 work, Carl Wunderlich concluded that temperatures above 100.4 degrees Fahrenheit should be considered feverish. In a 1992 study, Maryland researchers suggested that 99.9 degrees Fahrenheit was a more appropriate cutoff. If the oral temperatures of healthy humans are normally distributed with a mean of 98.23 and a standard deviation of. 67 (the values estimated by the Maryland researchers), what fraction of these readings is above 100.4? What fraction is above 99.9?
For a certain microwave oven and popcorn brand, the time taken by a randomly selected popcorn kernel to pop is normally distributed with a mean of 150 seconds and a standard deviation of 20 seconds. What percentage of the kernels do you expect to have popped after 180 seconds?
A science experiment involving one brand of microwave popcorn found that the time required to pop a kernel is approximately normally distributed with a mean of 129.0 seconds and a standard deviation of 9.6 seconds. Assuming that the time needed to pop a kernel is normally distributed with this mean and standard deviation and that kernel pops are independent, how long should we expect it to take for of the kernels to be popped? (Hint: .)
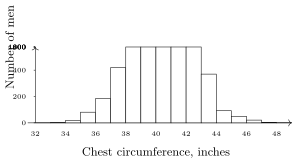
Here is histogram of the chest measurements of 5,738 Scottish militiamen in the early 19th century. Based on this figure, make rough estimates of the mean and standard deviation. You must come up with specific numbers and explain how you arrived at them. You will be graded not on whether your estimates are exactly right, but on whether you used a reasonable procedure to obtain your estimates.
Over the 141-year period 1878-2018, annual rainfall at the Los Angeles Civic Center averaged 14.50 inches with a standard deviation of 6.68 inches.
Annual rainfall was 3.60 inches in 2013. If rainfall each year is independent of rainfall in other years and randomly determined from a normal distribution with a mean of 14.50 inches and a standard deviation of 6.68 inches, what is the probability that annual rainfall in a randomly selected year would be so far below average?
Annual rainfall in Los Angeles is, in fact, not normally distributed. Explain why you believe that it is either skewed left or skewed right.
A college has found that half of the people they accept for admission decide to enroll. Assuming that enrollment decisions are independent, with each student having a .5 probability of enrolling, how many students should they admit if they want the expected value of the number of students who enroll to be 400? If they follow this admission policy, what is the probability that more than 420 will enroll? Use a normal approximation.
In the early 1960s, the National Center for Health Statistics estimated the heights of US males between the ages of 25 and 34 to be normally distributed with a mean of 69 inches and a standard deviation of 2.65 inches. Now the mean is estimated to be 70 inches, still with a standard deviation of 2.65 inches. If there are 25 million US males between the ages of 25 and 34, show how to determine the effect of this change in the height distribution on the number of males in this age bracket who are 6 feet 3 inches tall or taller.
Here is an example of "statistics-based economic analysis."
Statistics-based economic analysis utilizes the known probabilities associated with a bell curve; for example, there is only a chance of getting an observation that is two standard deviations above the mean. Suppose that the unemployment rate over the past 100 months has a mean of with a standard deviation of . If the unemployment rate in month 100 is , there is only chance the unemployment rate will go even higher, above 8, in month 101. What is the logical error in this reasoning?
A study of 225 female and 100 male residents of a Florida retirement community (all of whom were over the age of 65 with average ages of 73.7 years for females and 74.1 years for males), found that cholesterol levels were approximately normally distributed for each sex with a mean of 228.9 and standard deviation of 37.1 for females and a mean of 202.4 and standard deviation of 36.1 for males. Assuming these to be the population values for elderly females and males, what is the probability that a randomly selected elderly female has a cholesterol level above 250. What is the probability that a randomly selected elderly male has a cholesterol level above 250?
One measure of the performance of stock portfolio managers is
where n is the number of years being studied and m is the number of years that the manager did better than the median manager. Explain in simple English what means.
You are going to roll m standard six-sided dice n times. Each time you roll dice, you will add up the numbers on dice and record the sum. When you finish n trials, you will calculate the mean and standard deviation of n sums and draw a histogram.
Which do you expect to have a larger mean, 100 rolls of 4 dice or 1,000 rolls of 4 dice?
Which do you expect to have a larger standard deviation, 100 rolls of 4 dice or 1,000 rolls of 4 dice?
Which histogram do you expect to have a larger area, 100 rolls of 4 dice or 100 rolls of 40 dice?
Which histogram do you expect to look more like a normal distribution, 10,000 rolls of 4 dice or 1,000 rolls of 40 dice?
Which is more likely to be normally distributed: the number of heads obtained when 2 coins are flipped 1,000 times or the number of tails obtained when 10 coins are flipped 100 times?
Why do you suppose that the time it takes for bags of microwave popcorn to be fully popped is (approximately) normally distributed, but the time it takes students to answer ten math problems is not?
The Australian Bureau of Meteorology uses the monthly air-pressure difference between Tahiti and Darwin, Australia, to calculate the Southern Oscillation Index: SOI , where is the airpressure difference in the current month, is the average historical value of X for this month, and is the standard deviation of X for this month. Negative values of the SOI indicate an El Niño episode, which is usually accompanied by less-than-usual rainfall over eastern and northern Australia; positive SOI values indicate a La Niña episode, which is usually accompanied by more-than-usual rainfall. Suppose that X is normally distributed with a mean of and a standard deviation of . Explain why you believe that the probability of an SOI reading as low as -22.8, which occurred in 1994, is closer to , or. 110.
The daily high temperatures in two cities on December 31 can be described by normal distributions with City A having a mean of and a standard deviation of and City B having a mean of and a standard deviation of . Which city is more likely to have a daily high temperature below on December 31?
Suppose that a woman is randomly selected from a population in which heights are normally distributed with a mean of 66 inches and a standard deviation of 2.0 inches and that a male is independently selected from a population in which heights are normally distributed with a mean of 70 inches and a standard deviation of 2.5 inches. For each of the following questions, identify which outcome is more likely (you do NOT have to calculate the probabilities):
(i) Her height is more than 70 inches; or (ii) his height is less than 66 inches.
(i) Her height is more than 70 inches; or (ii) her height is more than 70 inches and his height is less than 66 inches.
(i) Her height is more than 70 inches; or (ii) either her height is more than 70 inches or his height is less than 66 inches.
(i) Her height is more than 66 inches and his height is more than 70 inches; or (ii) the sum of their heights is more than 136 inches.
The median circumference of the waists of adult US males is 34.2 inches. About have waists of 29.7 inches or less and have waists of 39.5 inches or less. How can you tell from the information given that waist circumferences are not normally distributed? Are waist circumferences positively or negatively skewed?
Most products are designed for the dimensions of the average person, with a margin that accommodates most but not all people. For instance, the torsos of adult US males are approximately normally distributed with a mean of 32 inches and a standard deviation of 2 inches.
If an automobile is designed with a seat-to-ceiling distance that accommodates a maximum torso length of 35 inches, what percentage of US adult males will not fit comfortably?
A company ordered these cars for all of its employees, of whom 100 are male. If the torso lengths of these males are considered a random selection from the male population as a whole, what is the probability that more than ten males will not fit comfortably? (Use a normal approximation.)
A Wall Street Journal poll in December 1986 asked 35 economic forecasters to predict the interest rate on 30-year Treasury bonds in June 1987. The mean of these 35 predictions was and the standard deviation was . If the predictions of all forecasters at that time were normally distributed with a mean of and a standard deviation of , what fraction of the forecasters predicted an interest rate of or higher, the actual value in June 1987?
Identify the assumption that is implicit in this claim in the Financial Analysts Journal: "Sixty-eight per cent of the time, a portfolio's return will be within plus or minus one standard deviation of its long-term average return."
Each semester, a teacher shows students a copy of the final exam that was given the previous semester in order to help them study for their final. Once, as the teacher passed out the previous semester's test, he warned, "There is inevitably variation in the difficulty of tests. This test was one standard deviation below the mean." Assuming normality, how would you interpret this remark?
A variable X is normally distributed with a mean of 10 and a standard deviation of 20. Identify the following statements as either true or false.
Do you agree or disagree with the following statements about X
The median of is equal to .
The standard deviation of is 1.
There is about a .95 probability that X will be more than two standard deviations from .
.
.
In 2018 Zillow launched a house-flipping business called Zillow Offers. The idea was that Zillow would use its market-value estimates to make a cash offer to homeowners who want a quick-and-easy sale. Zillow would then use local contractors to make minor repairs and maybe put in a new carpet and a fresh coat of paint and sell the house for a fast profit. The problem turned out to be that homeowners know more about the value of their homes than does Zillow.
Suppose that the errors in Zillow's price estimates are normally distributed with a mean of zero and a median absolute error of .
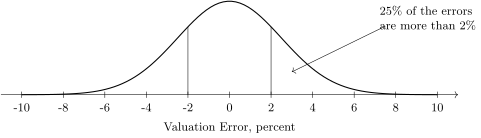
If every seller will only accept an offer from Zillow when the offer is at least too high, make a rough guess of the median valuation error for the homes Zillow buys. Will the mean valuation error be larger or smaller than the median?