Two-Sample Tests and Confidence Intervals
[36/100%]An A/B test is like an internet laboratory experiment. Two versions of a web page are created-typically the current page and a proposed modification, perhaps with a different banner, headline, or testimonial. A random number generator determines which page a user sees. A prespecified metric, like purchases or mailing-list signups, is used to determine the winning page.
The Obama 2008 presidential campaign used an A/B test to compare the number of web-page visitors who signed up for more information with these two buttons: "Sign Up" and "Learn More."
The results:
| Button | Visitors | Signups |
|---|---|---|
| Sign up | 77,858 | 5,851 |
| Learn More | 77,729 | 6,927 |
Why are the number of visitors not equal?
Is the difference between the observed number of signups substantial and statistically persuasive?
Under its original guidelines, the Environmental Protection Agency (EPA) concluded that second-hand smoke poses a cancer risk if a confidence interval for the difference in the incidence of cancer in the control and treatment groups excluded zero. In 1996 the EPA changed this criterion to a confidence interval. If, in fact, second-hand smoke does not pose a cancer risk, does a switch from a to confidence interval make it more or less likely that the EPA would conclude that second-hand smoke is a cancer risk?
A French hospital put 412 patients who had suffered one heart attack on a traditional Mediterranean diet (including olive oil, fruit, and bread); the control group consisted of 358 heart-attack patients who were given a recommended low-fat diet. Four of the patients on the Mediterranean diet and 17 of the patients on low-fat diet suffered a second heart attack during the 2 years of the study. Is the observed difference substantial and statistically persuasive?
A researcher compared the daily returns from a portfolio consisting of stocks that had been deleted from the Dow Jones Industrial Average with a portfolio consisting of the stocks that replaced them. Use these daily return data for a difference-in-means test and a matched-pair test. Which has the lower p-value? Why?
| Deletion | |||
|---|---|---|---|
| Portfolio | Addition | ||
| Portfolio | Difference | ||
| in Return | |||
| Mean | .000588 | .000433 | .000155 |
| Standard deviation | .012444 | .011862 | .008344 |
| Observations | 20,367 | 20,367 | 20,367 |
Evidence from many of sports indicate that performance is enhanced by our personal assessment of our ability. For example, when both contestants in an arm-wrestling study incorrectly believed the weaker person was stronger than his opponent, the weaker person won 10 of 12 matches. When the contestants had correct information about who was stronger, the stronger person won all 12 matches. Is this difference substantial and statistically persuasive?
A student played 100 games of Roshambo (rock, scissors, paper) against a computer software program, winning 32 games, losing 38, and drawing 30. The computer tried to figure out the player's strategy. This table separates the results into the first 50 games and the last 50 games:
| Player Won | Computer Won | Draw | |
|---|---|---|---|
| First 50 games | 19 | 16 | 15 |
| Second 50 games | 13 | 22 | 15 |
| Total | 32 | 38 | 30 |
Is the difference between the first- and second-half win percentages substantial and statistically persuasive?
The computer noticed that this player seldom repeated moves (like rock after rock). In 99 opportunities to repeat a move, the player only repeated seven times. Is this a substantial and statistically persuasive pattern?
A survey of 26 Division III athletes looked at their GPA during the semester they played their varsity sport and during the non-sport semester:
| Sport Season GPA | Off-season GPA | Difference | |
|---|---|---|---|
| Mean | 3.3250 | 3.4435 | -.1177 |
| Standard deviation | .3385 | .3097 | .2165 |
A difference-in-means test gave , with a two-sided p -value of .1939. A matched-pair test gave , with a two-sided p-value of .0104. Explain why these two tests can lead to different conclusions. Which test is more valid?
In a computer game, Blake is shown (in random order) either: (a) a rectangle that is yellow, blue, green, or red; or (b) the word yellow, blue, green, or red written in black. Blake's objective is to click as quickly as possible on the word at the bottom of the screen that matches the color or word shown in the middle of the screen. Here are the reaction times in seconds. Is the observed difference in average reaction time substantial and statistically persuasive?
| (a) Color | (b) Word | (a) Color | (b) Word |
|---|---|---|---|
| 1.12 | 1.02 | 1.13 | 1.07 |
| 1.15 | 1.28 | 1.13 | 1.03 |
| .95 | .95 | .98 | .78 |
| 1.08 | 1.17 | .95 | .88 |
| .93 | 1.03 | 1.62 | 1.05 |
| .82 | 1.15 | 1.33 | 1.20 |
| .88 | 1.12 | .83 | 1.05 |
| .83 | 1.18 | 1.13 | 1.00 |
| 1.17 | 1.38 | 1.52 | 1.20 |
| .90 | 1.08 | .98 | 1.32 |
The Unified Parkinson Disease Rating Scale (UPDRS) gauges the degree of Parkinson's disease in patients on a scale of , with 0 representing no disability and 199 total disability. Eleven subjects with Parkinson's disease were put on a regiment of riding stationary bikes 3 days a week for 12 weeks. Are the results substantial and statistically persuasive?
| Subject ID | UPDRS at Week 0 | UPDRS at Week 12 |
|---|---|---|
| TA | 16 | 3 |
| JC | 50 | 19 |
| LD | 23 | 5 |
| CE | 14 | 9 |
| FE | 18 | 5 |
| SF | 48 | 24 |
| KO | 20 | 3 |
| HP | 7 | 6 |
| DR | 2 | 3 |
| RS | 13 | 0 |
| JT | 17 | 10 |
Jerry's time in the 100 freestyle is normally distributed with a mean of 56 seconds and a standard deviation of 2 seconds; Kerry's time is normally distributed with a mean of 57 seconds and a standard deviation of 2.5 seconds. If their swim times are independent, what is the probability that Kerry will beat Jerry?
A study of 4 years of accident reports by the Dallas Fire Department found that fire trucks painted red made 153,348 runs and had 20 accidents, while fire trucks painted yellow made 135,035 runs and had 4 accidents. Assuming these to be independent random samples, is this difference substantial and statistically persuasive?
Explain the error(s) in this remark:
We used a matched-pair test instead of a difference-in-means test because a matched-pair test does not assume that the two samples have the same standard deviation.
In 1983 22,000 doctors participated in an experiment testing the effects of aspirin on the incidence of heart attacks. Half of the doctors were given a single aspirin tablet every other day; the other half took a placebo every other day. Neither the volunteers or the scientists conducting the experiment knew which volunteers were taking aspirin. After 5 years of what was intended to be a 7 -year test, the experiments were stopped by an outside committee monitoring the results. During this period, the doctors taking placebos had 18 fatal heart attacks and the doctors taking aspirin had 5. Is this difference substantial and statistically persuasive? Why do you suppose the experiment was stopped 2 years early?
In horseshoes, each player pitches two shoes in each inning. If the player pitches two ringers, this is called a double. A "hot hands" study of the 2000 World Horseshoe Pitching championships looked at whether players were more likely or less likely to throw a double after throwing a double in the previous inning. For example, female pitchers threw 1641 doubles and 1691 nondoubles after a nondouble inning, and threw 2142 doubles and 1666 nondoubles after a doubles inning. Is the difference substantial and statistically persuasive?
A treatment group was given a cold vaccine, while the control group received a placebo. Doctors then recorded the fraction of each group that caught a cold and calculated the two-sided p-value to be .08. Explain why you either agree or disagree with each of these interpretations of these results:
"There is an probability that this vaccine works."
"If a randomly selected person takes this vaccine, the chances of getting sick fall by about ."
"These data do not show a statistically significant effect at the level; therefore, we are certain that this vaccine doesn't work."
What is obviously wrong with this report of the results of a differ-ence-in-means test: "With 38 degrees of freedom, the t -value is 8.98 and the 2 -sided p -value is .2916. In this test, the null hypothesis cannot be rejected at the or level because the p -value is far too high."
Suppose that you run an experiment involving a treatment group and a control group with 20 subjects in each sample and a difference-inmeans test gives a -value of 2.7 and a two-sided p-value of .01. Which of these statements are true and which are false?
The probability that the null hypothesis is true is .01.
The probability that the treatment works is .99.
If you reject the null hypothesis, the probability that you made the wrong decision is .01.
If the study is done again, there is a .99 probability of obtaining the same results.
A 2021 study compared the calories in 20 McDonald's menu items sold in the United States and the United Kingdom:
| United States | United Kingdom | ||
|---|---|---|---|
| Big Mac | 550 | 508 | |
| Quarter pounder w/cheese | 520 | 518 | |
| Double quarter pounder w/cheese | 740 | 750 | |
| Hamburger | 250 | 250 | |
| Cheeseburger | 300 | 301 | |
| Double cheeseburger | 450 | 445 | |
| McChicken | 400 | 388 | |
| Filet-o-fish | 380 | 329 | |
| Sausage \ | egg McMuffin | 480 | 430 |
| Six-piece chicken nuggets | 255 | 259 | |
| French fries (regular) | 320 | 337 | |
| Pancakes | 580 | 477 | |
| Apple pie | 240 | 250 | |
| McFlurry Oreo | 340 | 258 | |
| Chocolate milkshake | 520 | 468 | |
| Vanilla milkshake | 510 | 469 | |
| Strawberry milkshake | 530 | 458 | |
| Cappuccino | 120 | 128 | |
| Caramel frappuccino | 420 | 399 | |
| Hot chocolate | 370 | 231 |
Carefully explain how you would determine if the differences are statistically persuasive. You do not need to do any calculations, but you should explain, step-by-step, the calculations you would make.
Carefully explain how you would determine if the observed differences are substantial. Again, do not do any actual calculations.
Students in one California school district are classified as either a gifted and talented education (GATE) student or a regular student. A survey of seventh- and eighth-graders found that 10 of 86 GATE students had mothers who did not attend college and that 35 of 124 regular students had mothers who did not attend college. Is this difference substantial and statistically persuasive?
College students rated their intelligence and preparedness for life after college on a scale of 1-10.
Explain why this argument either does or does not make sense.
I interviewed 150 students of all sexes and years. However, since my study required me to compare two groups (underclassmen and upperclassmen), I couldn't use all my data because there would be more students in one group than the other. So, I randomly selected 10 underclassmen and 10 upperclassmen.
What is wrong with this conclusion?
I found that despite my original predictions, there was no statistical significance. The -values were greater than .05, making them statistically insignificant at the level. This means that even though one would expect upperclassmen to feel more intelligent and more prepared for life after college, they do not perceive themselves as so.
Explain why the proposed test is wrong and identify the correct test:
My question is "Does playing on home ice in the National Hockey League (NHL) give the home team a better chance to win?" I will choose six NHL teams and, for each team, use a Z single-sample categorical test of the null hypothesis that the chance of winning at home is equal to one half.
A researcher compared the Internet prices of 20 Abercrombie Fitch (AF) male clothing items with the prices of virtually identical clothes sold by Hollister, which is owned by AF. The average price of the 20 AF items was , while the average price of the 20 Hollister items was . The t -value was 3.38 using a two-sample test and 7.01 using a matched-pair test.
Which test had a lower two-sided p-value?
Explain to someone who has not taken a statistics course why the t -values could be so different.
The matched pair data were used to calculate a confidence interval for the price difference: . Explain why you either agree or disagree with this interpretation: "That is to say, of the calculated price difference values will be in the range of to ."
A researcher looked at the 20 English soccer clubs that played in the Premier League during the 2009-2010 season. These teams won an average of 9.65 out of 19 home games, with a standard deviation of 3.79, and won 4.55 out of 19 away games, with a standard deviation of 3.15. (Games that were not won were either lost or tied.) He then calculated the t -value for a two-sample test of the null hypothesis that the average number of wins in home games is equal to the average number of wins in away games:
What assumption underlying the two-sample t-test is violated?
Do you agree that 20 is the correct sample size?
What is wrong with this t -value formula?
California birth records were used to obtain data on the ZIP code residence of mothers when they gave birth to a daughter and the ZIP code residence of these daughters when they gave birth to a child. Of the 4,298 daughters of foreign-born mothers who lived in different ZIP codes, 2,579 lived in ZIP codes with higher median income than their mother's ZIP code and 1,719 lived in ZIP codes with lower income. For the 5,935 daughters of California-born mothers who lived in different ZIP codes, 3,181 lived in ZIP codes with higher median income than their mother's ZIP code and 2,754 lived in ZIP codes with lower median income. Is this difference between the daughters of foreign-born and California-born mothers substantial and statistically persuasive?
The 794 students in Pomona College's freshmen classes of 1987-1988 and 1988-1989 were separated into two groups: 552 who had attended public high schools and 242 who had attended private schools. Of those from public schools, were Pomona Scholars (an A-grade point average); of those from private schools, were Pomona Scholars. Does the observed difference seem substantial? The author calculated the Z-value to be 1.64 and concluded that although "two classes proved the null hypothesis to be true, ...the sample size is minuscule." Did she prove the null hypothesis to be true? Are her results invalidated by the small sample size?
About one-third of the applicants admitted to one small college actually enroll. Is there a difference between the average SAT scores of those who enroll and those who do not? Here are some recent data:
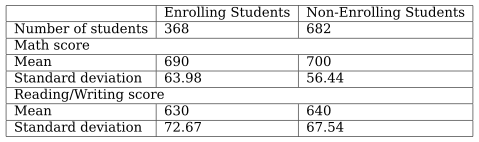
Comparing the enrolling and non-enrolling students, are the observed differences in the math scores substantial and statistically persuasive? What about the reading/writing scores?
Explain the error in this interpretation:
According to the central limit theorem, the means of both groups are normally distributed:
Explain the error in this statement:
Under the null hypothesis, the difference in the sample means is zero.
In the 1980s Kahneman and Tversky reported that when 200 people were asked the following question, 98 answered yes and 108 answered no:
Imagine that you have decided to see a play and paid the admission price of per ticket. As you enter the theater, you discover that you have lost the ticket. The seat is not marked and the ticket cannot be recovered. Would you pay $10 for another ticket? When 183 people were asked the following question, 161 answered yes and 22 answered no:
Imagine that you have decided to see a play where admission is $10 per ticket. As you enter the theater, you discover that you have lost a $10 bill. Would you still pay $10 for a ticket for the play? Is the difference in responses substantial and statistically persuasive?
Two polling organizations report these voter preferences:
| John | Jane | Sample Size | |
|---|---|---|---|
| Poll A | 600 | ||
| Poll B | 200 |
Can the difference in these poll results be explained by sampling error? If you have no reason to believe one poll is more reliable than the other, what would you use for a prediction of each candidate's vote percentage?
One hundred randomly selected students were asked to rate the qualifications of two job candidates based on a resume. Half were given the resume for a mythical John Benson and half were given another resume, identical to the first in all respects except that the name was Mary Benson. The results:
| John Benson | Mary Benson | |
|---|---|---|
| Number of ratings | 50 | 50 |
| Average rating | 8.23 | 8.02 |
| Standard deviation | 1.15 | 2.18 |
Is the observed difference substantial and statistically persuasive?
Basketball players are often told that a missed shot usually bounces to the opposite side of the basket from which the shot is taken; for example, that a missed shot from the right side of the basket usually bounces to the left of the basket. A college player suspected that this tendency may be reversed at the end of a game, when the players are tired and their missed shots bounce off the front of the rim. A study of the first and last 10 minutes of videotapes of four different Division III male basketball teams yielded the data shown below. Use these data to see if the difference between the first and last 10 minutes is substantial and statistically persuasive.
| Same Side | Opposite Side | |
|---|---|---|
| First 10 minutes | 16 | 25 |
| Last 10 minutes | 20 | 10 |
Before coming to college, a student watched videotapes of a seminar, "Where there's a will, there's an A," which purports to show scientifically supported strategies for guaranteeing A grades. One strategy is to sit in the front of the class. To test this theory, a statistics student asked 50 randomly selected college students to write down their grade point average (GPA) and to indicate where they typically sit in large classrooms.
| Number of Students | Average GPA (12-Point Scale) | |
|---|---|---|
| In the very front | 5 | 10.94 |
| Toward the front | 21 | 9.38 |
| In the middle | 11 | 9.38 |
| Toward the back | 10 | 8.37 |
| In the very back | 3 | 10.20 |
The student used a difference-in-means test to compare the average GPA of the 26 students who sit either in the very front or toward the front with the average GPA of all 50 students. What crucial assumption is violated by this procedure? What should he have done instead?
After examining the data showing that college students who sit near the front of the classroom have relatively high GPAs, he concluded, "I would certainly advise a freshman to consistently sit in the front row in every single class." Provide a very different interpretation of his data.
Data were obtained for the finals of the women's 800 -meter run at the Southern California Intercollegiate Athletic Conference Track and Field Championships. In three of the years studied (1983, 1986, and 1990), the meet was held on a dirt track; in three other years (1987, 1988, and 1989), an artificial surface was used. Is the observed difference in the average times substantial and statistically persuasive?
| Dirt Track | Artificial | |
|---|---|---|
| Number of runners | 18 | 18 |
| Average time (seconds) | 144.90 | 143.11 |
| Standard deviation | 4.83 | 4.33 |
A study comparing the grades given by female and male students to an essay written by a male found that female graders gave an average grade of 7.125 and male graders gave an average grade of 7.500.
A reader said that one flaw in the study was that "the number of male graders was not equal to the number of female graders." Explain why this either is or is not a flaw.
Explain why you either agree or disagree with this interpretation of the results: "The t -value was 0.5800, with a p -value of 0.5721. This can be interpreted as there being a chance that the means of 7.500 for male graders and 7.125 for female graders were 0.5800 standard deviations away from each other."
A random sample of 25 male college students and 25 female college students were each asked to name their favorite singer; 21 of the males named a male singer and 16 of the females named a male singer. Explain the error in this test of the null hypothesis that male and female students are equally likely to name a male singer: "The pooled proportion is . We tested the null hypothesis with the following Z statistic:"
From the 30 stocks in the Dow Jones Industrial Average, a researcher identified the ten stocks with the highest dividend-price (D/P) ratios and the ten stocks with the lowest D/P ratios on December 31, 2021. Here are the percentage returns over the next year:
| High D/P | Low D/P |
|---|---|
| 39.77 | -37.74 |
| 32.01 | 46.83 |
| 28.93 | -5.81 |
| 32.30 | 48.04 |
| 31.28 | 20.91 |
| 12.17 | 20.24 |
| 40.68 | 1.05 |
| 14.33 | -28.10 |
| 40.39 | 17.03 |
| 37.74 | -1.55 |
Display these data in two side-by-side box plots. Do the data appear to have similar or dissimilar means and standard deviations?
Is the observed difference in the average returns substantial and statistically persuasive?
A 2002 study compared radical prostatectomy to watchful waiting for the treatment of localized prostate cancer: 53 of 347 patients in the prostatectomy group died, as did 62 of 348 patients in the control group. The p -value for a test of the null hypothesis that there was no difference in the death rates was .367. Explain why you either agree or disagree with the conclusion of the US Preventive Services Task Force that there was "no difference between the two groups in overall mortality."